ディープラーニングでよくみるグリッド上の画像を作りたいのでやってみた
from keras.datasets import mnist
from matplotlib import pyplot as plt
import numpy as np

(X_train, ), (X_test, y_test) = mnist.load_data()

row = 5
col = 4
plt.figure(figsize=(10,10))

num = 0

while num < row * col:
    num += 1
    plt.subplot(row, col, num)
    plt.imshow(X_train[num])
    plt.axis('off')
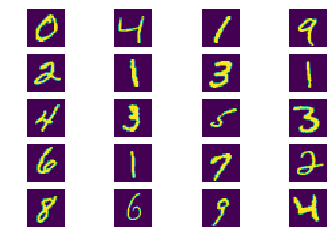
これを実行するとこうなる

subplotの引数rowとcolは固定値で、行と列の数を表す
numは左上から数えて何番目に表すか表示する変数であり、2次元の座標を指定するわけではないので注意
axis(‘off’)で軸ラベルを消すことができる
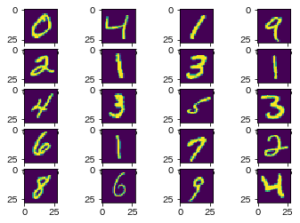
消さなかったらこんな感じ

グラフの場合は軸が大切だが、画像を並べる場合だと少し見にくくなる
凡ミスとして、axisとaxesを間違えないよう気をつける
参考
matplotlib.pyplot.subplot — Matplotlib 3.10.8 documentation
matplotlib.pyplot.axis — Matplotlib 3.10.8 documentation


コメント