
Raspberry pi に温度と湿度を測れるセンサーを繋いでPrometheusに送り、Grafanaで可視化していた。
しかし、温度と湿度を同じグラフに載せると、それぞれの値が取りうる範囲が違うので、意図したスケールにならない。
そこで、温度は左側、湿度は右側になるような設定を探してみた。
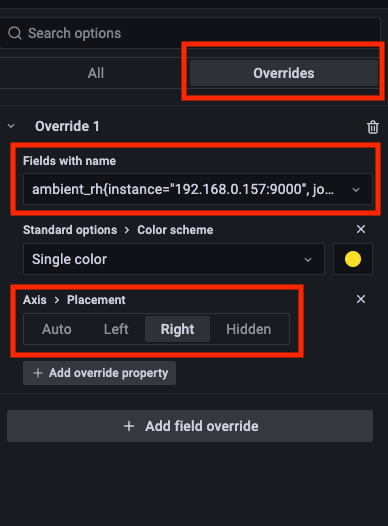
Overridesで対象となるmetricを指定し、Axis > PlacementのRightを選べばOK。
これでスケールの違う項目を同じグラフに表示して見やすくなった。
参考

Grafana8.1: how to show two lines in one panel and use both left/right y axis?
I can show two lines on one panel; and now I want to set the first line to use left y axis, the second line to use right...
community.grafana.com

コメント